44. Supply and Demand with Many Goods#
44.1. Overview#
In a previous lecture we studied supply, demand and welfare in a market with a single consumption good.
In this lecture, we study a setting with \(n\) goods and \(n\) corresponding prices.
Key infrastructure concepts that we’ll encounter in this lecture are
inverse demand curves
marginal utilities of wealth
inverse supply curves
consumer surplus
producer surplus
social welfare as a sum of consumer and producer surpluses
competitive equilibrium
We will provide a version of the first fundamental welfare theorem, which was formulated by
Important extensions to the key ideas were obtained by
We shall describe two classic welfare theorems:
first welfare theorem: for a given distribution of wealth among consumers, a competitive equilibrium allocation of goods solves a social planning problem.
second welfare theorem: An allocation of goods to consumers that solves a social planning problem can be supported by a competitive equilibrium with an appropriate initial distribution of wealth.
As usual, we start by importing some Python modules.
# import some packages
import numpy as np
import matplotlib.pyplot as plt
from scipy.linalg import inv
44.2. Formulas from linear algebra#
We shall apply formulas from linear algebra that
differentiate an inner product with respect to each vector
differentiate a product of a matrix and a vector with respect to the vector
differentiate a quadratic form in a vector with respect to the vector
Where \(a\) is an \(n \times 1\) vector, \(A\) is an \(n \times n\) matrix, and \(x\) is an \(n \times 1\) vector:
44.3. From utility function to demand curve#
Our study of consumers will use the following primitives
\(\Pi\) be an \(m \times n\) matrix,
\(b\) be an \(m \times 1\) vector of bliss points,
\(e\) be an \(n \times 1\) vector of endowments, and
We will analyze endogenous objects \(c\) and \(p\), where
\(c\) is an \(n \times 1\) vector of consumptions of various goods,
\(p\) is an \(n \times 1\) vector of prices
The matrix \(\Pi\) describes a consumer’s willingness to substitute one good for every other good.
We assume that \(\Pi\) has linearly independent columns, which implies that \(\Pi^\top \Pi\) is a positive definite matrix.
it follows that \(\Pi^\top \Pi\) has an inverse.
We shall see below that \((\Pi^\top \Pi)^{-1}\) is a matrix of slopes of (compensated) demand curves for \(c\) with respect to a vector of prices:
A consumer faces \(p\) as a price taker and chooses \(c\) to maximize the utility function
subject to the budget constraint
We shall specify examples in which \(\Pi\) and \(b\) are such that it typically happens that
This means that the consumer has much less of each good than he wants.
The deviation in (44.3) will ultimately assure us that competitive equilibrium prices are positive.
44.3.1. Demand curve implied by constrained utility maximization#
For now, we assume that the budget constraint is (44.2).
So we’ll be deriving what is known as a Marshallian demand curve.
Our aim is to maximize (44.1) subject to (44.2).
Form a Lagrangian
where \(\mu\) is a Lagrange multiplier that is often called a marginal utility of wealth.
The consumer chooses \(c\) to maximize \(L\) and \(\mu\) to minimize it.
First-order conditions for \(c\) are
so that, given \(\mu\), the consumer chooses
Substituting (44.4) into budget constraint (44.2) and solving for \(\mu\) gives
Equation (44.5) tells how marginal utility of wealth depends on the endowment vector \(e\) and the price vector \(p\).
44.4. Endowment economy#
We now study a pure-exchange economy, or what is sometimes called an endowment economy.
Consider a single-consumer, multiple-goods economy without production.
The only source of goods is the single consumer’s endowment vector \(e\).
A competitive equilibrium price vector induces the consumer to choose \(c=e\).
This implies that the equilibrium price vector satisfies
In the present case where we have imposed budget constraint in the form (44.2), we are free to normalize the price vector by setting the marginal utility of wealth \(\mu =1\) (or any other value for that matter).
This amounts to choosing a common unit (or numeraire) in which prices of all goods are expressed.
(Doubling all prices will affect neither quantities nor relative prices.)
We’ll set \(\mu=1\).
Exercise 44.2
Verify that setting \(\mu=2\) in (44.4) also implies that formula (44.5) is satisfied.
Here is a class that computes competitive equilibria for our economy.
class ExchangeEconomy:

    def __init__(self,
                 Π,
                 b,
                 e,
                 thres=1.5):
        """
        Set up the environment for an exchange economy

        Args:
            Π (np.array): shared matrix of substitution
            b (list):  the consumer's bliss point
            e (list):  the consumer's endowment
            thres (float): a threshold to check p >> Π e condition
        """

        # check non-satiation
        if np.min(b / np.max(Π @ e)) <= thres:
            raise Exception('set bliss points further away')


        self.Π, self.b, self.e = Π, b, e


    def competitive_equilibrium(self):
        """
        Compute the competitive equilibrium prices and allocation
        """
        Π, b, e = self.Π, self.b, self.e

        # compute price vector with μ=1
        p = Π.T @ b - Π.T @ Π @ e

        # compute consumption vector
        slope_dc = inv(Π.T @ Π)
        Π_inv = inv(Π)
        c = Π_inv @ b - slope_dc @ p

        if any(c < 0):
            print('allocation: ', c)
            raise Exception('negative allocation: equilibrium does not exist')

        return p, c
44.5. Digression: Marshallian and Hicksian demand curves#
Sometimes we’ll use budget constraint (44.2) in situations in which a consumer’s endowment vector \(e\) is his only source of income.
Other times we’ll instead assume that the consumer has another source of income (positive or negative) and write his budget constraint as
where \(w\) is measured in “dollars” (or some other numeraire) and component \(p_i\) of the price vector is measured in dollars per unit of good \(i\).
Whether the consumer’s budget constraint is (44.2) or (44.6) and whether we take \(w\) as a free parameter or instead as an endogenous variable will affect the consumer’s marginal utility of wealth.
Consequently, how we set \(\mu\) determines whether we are constructing
a Marshallian demand curve, as when we use (44.2) and solve for \(\mu\) using equation (44.5) above, or
a Hicksian demand curve, as when we treat \(\mu\) as a fixed parameter and solve for \(w\) from (44.6).
Marshallian and Hicksian demand curves contemplate different mental experiments:
For a Marshallian demand curve, hypothetical changes in a price vector have both substitution and income effects
income effects are consequences of changes in \(p^\top e\) associated with the change in the price vector
For a Hicksian demand curve, hypothetical price vector changes have only substitution effects
changes in the price vector leave \(p^\top e + w\) unaltered because we freeze \(\mu\) and solve for \(w\)
Sometimes a Hicksian demand curve is called a compensated demand curve in order to emphasize that, to disarm the income (or wealth) effect associated with a price change, the consumer’s wealth \(w\) is adjusted.
We’ll discuss these distinct demand curves more below.
44.6. Dynamics and risk as special cases#
Special cases of our \(n\)-good pure exchange model can be created to represent
dynamics — by putting different dates on different commodities
risk — by interpreting delivery of goods as being contingent on states of the world whose realizations are described by a known probability distribution
Let’s illustrate how.
44.6.1. Dynamics#
Suppose that we want to represent a utility function
where \(\beta \in (0,1)\) is a discount factor, \(c_1\) is consumption at time \(1\) and \(c_2\) is consumption at time 2.
To capture this with our quadratic utility function (44.1), set
and
The budget constraint (44.2) becomes
The left side is the discounted present value of consumption.
The right side is the discounted present value of the consumer’s endowment.
The relative price \(\frac{p_1}{p_2}\) has units of time \(2\) goods per unit of time \(1\) goods.
Consequently,
is the gross interest rate and \(r\) is the net interest rate.
Here is an example.
beta = 0.95

Π = np.array([[1, 0],
              [0, np.sqrt(beta)]])

b = np.array([5, np.sqrt(beta) * 5])

e = np.array([1, 1])

dynamics = ExchangeEconomy(Π, b, e)
p, c = dynamics.competitive_equilibrium()

print('Competitive equilibrium price vector:', p)
print('Competitive equilibrium allocation:', c)
Competitive equilibrium price vector: [4.  3.8]
Competitive equilibrium allocation: [1. 1.]
44.6.2. Risk and state-contingent claims#
We study risk in the context of a static environment, meaning that there is only one period.
By risk we mean that an outcome is not known in advance, but that it is governed by a known probability distribution.
As an example, our consumer confronts risk means in particular that
there are two states of nature, \(1\) and \(2\).
the consumer knows that the probability that state \(1\) occurs is \(\lambda\).
the consumer knows that the probability that state \(2\) occurs is \((1-\lambda)\).
Before the outcome is realized, the consumer’s expected utility is
where
\(c_1\) is consumption in state \(1\)
\(c_2\) is consumption in state \(2\)
To capture these preferences we set
A consumer’s endowment vector is
A price vector is
where \(p_i\) is the price of one unit of consumption in state \(i \in \{1, 2\}\).
The state-contingent goods being traded are often called Arrow securities.
Before the random state of the world \(i\) is realized, the consumer sells his/her state-contingent endowment bundle and purchases a state-contingent consumption bundle.
Trading such state-contingent goods is one way economists often model insurance.
We use the tricks described above to interpret \(c_1, c_2\) as “Arrow securities” that are state-contingent claims to consumption goods.
Here is an instance of the risk economy:
prob = 0.2

Π = np.array([[np.sqrt(prob), 0],
              [0, np.sqrt(1 - prob)]])

b = np.array([np.sqrt(prob) * 5, np.sqrt(1 - prob) * 5])

e = np.array([1, 1])

risk = ExchangeEconomy(Π, b, e)
p, c = risk.competitive_equilibrium()

print('Competitive equilibrium price vector:', p)
print('Competitive equilibrium allocation:', c)
Competitive equilibrium price vector: [0.8 3.2]
Competitive equilibrium allocation: [1. 1.]
Exercise 44.3
Consider the instance above.
Please numerically study how each of the following cases affects the equilibrium prices and allocations:
the consumer gets poorer,
they like the first good more, or
the probability that state \(1\) occurs is higher.
Hints. For each case choose some parameter \(e, b, \text{ or } \lambda\) different from the instance.
Solution to Exercise 44.3
First consider when the consumer is poorer.
Here we just decrease the endowment.
risk.e = np.array([0.5, 0.5])

p, c = risk.competitive_equilibrium()

print('Competitive equilibrium price vector:', p)
print('Competitive equilibrium allocation:', c)
Competitive equilibrium price vector: [0.9 3.6]
Competitive equilibrium allocation: [0.5 0.5]
If the consumer likes the first (or second) good more, then we can set a larger bliss value for good 1.
risk.b = np.array([np.sqrt(prob) * 6, np.sqrt(1 - prob) * 5])
p, c = risk.competitive_equilibrium()

print('Competitive equilibrium price vector:', p)
print('Competitive equilibrium allocation:', c)
Competitive equilibrium price vector: [1.1 3.6]
Competitive equilibrium allocation: [0.5 0.5]
Increase the probability that state \(1\) occurs.
prob = 0.8

Π = np.array([[np.sqrt(prob), 0],
              [0, np.sqrt(1 - prob)]])

b = np.array([np.sqrt(prob) * 5, np.sqrt(1 - prob) * 5])

e = np.array([1, 1])

risk = ExchangeEconomy(Π, b, e)
p, c = risk.competitive_equilibrium()

print('Competitive equilibrium price vector:', p)
print('Competitive equilibrium allocation:', c)
Competitive equilibrium price vector: [3.2 0.8]
Competitive equilibrium allocation: [1. 1.]
44.7. Economies with endogenous supplies of goods#
Up to now we have described a pure exchange economy in which endowments of goods are exogenous, meaning that they are taken as given from outside the model.
44.7.1. Supply curve of a competitive firm#
A competitive firm that can produce goods takes a price vector \(p\) as given and chooses a quantity \(q\) to maximize total revenue minus total costs.
The firm’s total revenue equals \(p^\top q\) and its total cost equals \(C(q)\) where \(C(q)\) is a total cost function
and \(J\) is a positive definite matrix.
So the firm’s profits are
An \(n\times 1\) vector of marginal costs is
where
The firm maximizes total profits by setting marginal revenue to marginal costs.
An \(n \times 1\) vector of marginal revenues for the price-taking firm is \(\frac{\partial p^\top q} {\partial q} = p \).
So price equals marginal revenue for our price-taking competitive firm.
This leads to the following inverse supply curve for the competitive firm:
44.7.2. Competitive equilibrium#
To compute a competitive equilibrium for a production economy where demand curve is pinned down by the marginal utility of wealth \(\mu\), we first compute an allocation by solving a planning problem.
Then we compute the equilibrium price vector using the inverse demand or supply curve.
44.7.2.1. \(\mu=1\) warmup#
As a special case, let’s pin down a demand curve by setting the marginal utility of wealth \(\mu =1\).
Equating supply price to demand price and letting \(q=c\) we get
which implies the equilibrium quantity vector
This equation is the counterpart of equilibrium quantity (7.3) for the scalar \(n=1\) model with which we began.
44.7.2.2. General \(\mu\neq 1\) case#
Now let’s extend the preceding analysis to a more general case by allowing \(\mu \neq 1\).
Then the inverse demand curve is
Equating this to the inverse supply curve, letting \(q=c\) and solving for \(c\) gives
44.7.3. Implementation#
A Production Economy will consist of
a single person that we’ll interpret as a representative consumer
a single set of production costs
a multiplier \(\mu\) that weights “consumers” versus “producers” in a planner’s welfare function, as described above in the main text
an \(n \times 1\) vector \(p\) of competitive equilibrium prices
an \(n \times 1\) vector \(c\) of competitive equilibrium quantities
consumer surplus
producer surplus
Here we define a class ProductionEconomy.
class ProductionEconomy:

    def __init__(self,
                 Π,
                 b,
                 h,
                 J,
                 μ):
        """
        Set up the environment for a production economy

        Args:
            Π (np.ndarray): matrix of substitution
            b (np.array): bliss points
            h (np.array): h in cost func
            J (np.ndarray): J in cost func
            μ (float): welfare weight of the corresponding planning problem
        """
        self.n = len(b)
        self.Π, self.b, self.h, self.J, self.μ = Π, b, h, J, μ

    def competitive_equilibrium(self):
        """
        Compute a competitive equilibrium of the production economy
        """
        Π, b, h, μ, J = self.Π, self.b, self.h, self.μ, self.J
        H = .5 * (J + J.T)

        # allocation
        c = inv(Π.T @ Π + μ * H) @ (Π.T @ b - μ * h)

        # price
        p = 1 / μ * (Π.T @ b - Π.T @ Π @ c)

        # check non-satiation
        if any(Π @ c - b >= 0):
            raise Exception('invalid result: set bliss points further away')

        return c, p

    def compute_surplus(self):
        """
        Compute consumer and producer surplus for single good case
        """
        if self.n != 1:
            raise Exception('not single good')
        h, J, Π, b, μ = self.h.item(), self.J.item(), self.Π.item(), self.b.item(), self.μ
        H = J

        # supply/demand curve coefficients
        s0, s1 = h, H
        d0, d1 = 1 / μ * Π * b, 1 / μ * Π**2

        # competitive equilibrium
        c, p = self.competitive_equilibrium()

        # calculate surplus
        c_surplus = d0 * c - .5 * d1 * c**2 - p * c
        p_surplus = p * c - s0 * c - .5 * s1 * c**2

        return c_surplus, p_surplus
Then define a function that plots demand and supply curves and labels surpluses and equilibrium.
44.7.3.1. Example: single agent with one good and production#
Now let’s construct an example of a production economy with one good.
To do this we
specify a single person and a cost curve in a way that lets us replicate the simple single-good supply demand example with which we started
compute equilibrium \(p\) and \(c\) and consumer and producer surpluses
draw graphs of both surpluses
do experiments in which we shift \(b\) and watch what happens to \(p, c\).
Π = np.array([[1]])  # the matrix now is a singleton
b = np.array([10])
h = np.array([0.5])
J = np.array([[1]])
μ = 1

PE = ProductionEconomy(Π, b, h, J, μ)
c, p = PE.competitive_equilibrium()

print('Competitive equilibrium price:', p.item())
print('Competitive equilibrium allocation:', c.item())

# plot
plot_competitive_equilibrium(PE)
Competitive equilibrium price: 5.25
Competitive equilibrium allocation: 4.75
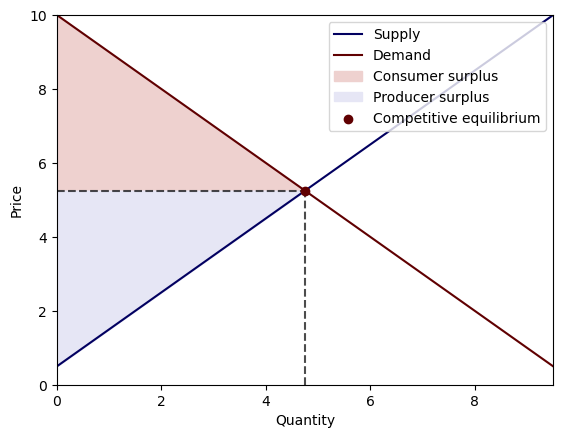
c_surplus, p_surplus = PE.compute_surplus()

print('Consumer surplus:', c_surplus.item())
print('Producer surplus:', p_surplus.item())
Consumer surplus: 11.28125
Producer surplus: 11.28125
Let’s give the consumer a lower welfare weight by raising \(\mu\).
PE.μ = 2
c, p = PE.competitive_equilibrium()

print('Competitive equilibrium price:', p.item())
print('Competitive equilibrium allocation:', c.item())

# plot
plot_competitive_equilibrium(PE)
Competitive equilibrium price: 3.5
Competitive equilibrium allocation: 3.0
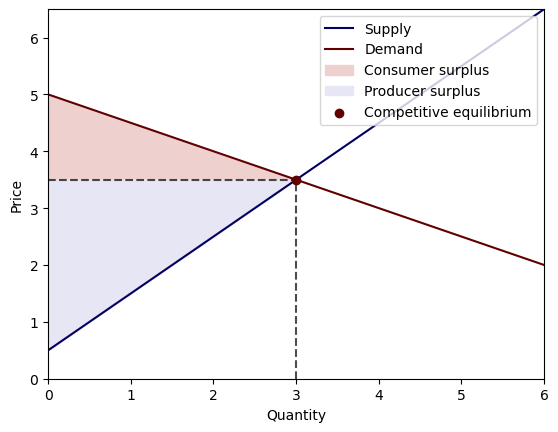
c_surplus, p_surplus = PE.compute_surplus()

print('Consumer surplus:', c_surplus.item())
print('Producer surplus:', p_surplus.item())
Consumer surplus: 2.25
Producer surplus: 4.5
Now we change the bliss point so that the consumer derives more utility from consumption.
PE.μ = 1
PE.b = PE.b * 1.5
c, p = PE.competitive_equilibrium()

print('Competitive equilibrium price:', p.item())
print('Competitive equilibrium allocation:', c.item())

# plot
plot_competitive_equilibrium(PE)
Competitive equilibrium price: 7.75
Competitive equilibrium allocation: 7.25
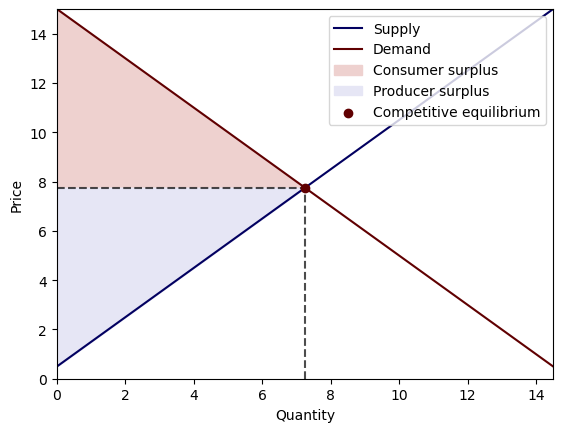
This raises both the equilibrium price and quantity.
44.7.3.2. Example: single agent two-good economy with production#
we’ll do some experiments like those above
we can do experiments with a diagonal \(\Pi\) and also with a non-diagonal \(\Pi\) matrix to study how cross-slopes affect responses of \(p\) and \(c\) to various shifts in \(b\) (TODO)
Π = np.array([[1, 0],
              [0, 1]])

b = np.array([10, 10])

h = np.array([0.5, 0.5])

J = np.array([[1, 0.5],
              [0.5, 1]])
μ = 1

PE = ProductionEconomy(Π, b, h, J, μ)
c, p = PE.competitive_equilibrium()

print('Competitive equilibrium price:', p)
print('Competitive equilibrium allocation:', c)
Competitive equilibrium price: [6.2 6.2]
Competitive equilibrium allocation: [3.8 3.8]
PE.b = np.array([12, 10])

c, p = PE.competitive_equilibrium()

print('Competitive equilibrium price:', p)
print('Competitive equilibrium allocation:', c)
Competitive equilibrium price: [7.13333333 6.46666667]
Competitive equilibrium allocation: [4.86666667 3.53333333]
PE.Π = np.array([[1, 0.5],
                 [0.5, 1]])

PE.b = np.array([10, 10])

c, p = PE.competitive_equilibrium()

print('Competitive equilibrium price:', p)
print('Competitive equilibrium allocation:', c)
Competitive equilibrium price: [6.3 6.3]
Competitive equilibrium allocation: [3.86666667 3.86666667]
PE.b = np.array([12, 10])
c, p = PE.competitive_equilibrium()

print('Competitive equilibrium price:', p)
print('Competitive equilibrium allocation:', c)
Competitive equilibrium price: [7.23333333 6.56666667]
Competitive equilibrium allocation: [4.93333333 3.6       ]
44.7.4. Digression: a supplier who is a monopolist#
A competitive firm is a price-taker who regards the price and therefore its marginal revenue as being beyond its control.
A monopolist knows that it has no competition and can influence the price and its marginal revenue by setting quantity.
A monopolist takes a demand curve and not the price as beyond its control.
Thus, instead of being a price-taker, a monopolist sets prices to maximize profits subject to the inverse demand curve (44.9).
So the monopolist’s total profits as a function of its output \(q\) is
After finding first-order necessary conditions for maximizing monopoly profits with respect to \(q\) and solving them for \(q\), we find that the monopolist sets
We’ll soon see that a monopolist sets a lower output \(q\) than does either a
planner who chooses \(q\) to maximize social welfare
a competitive equilibrium
Exercise 44.4
Please verify the monopolist’s supply curve (44.12).
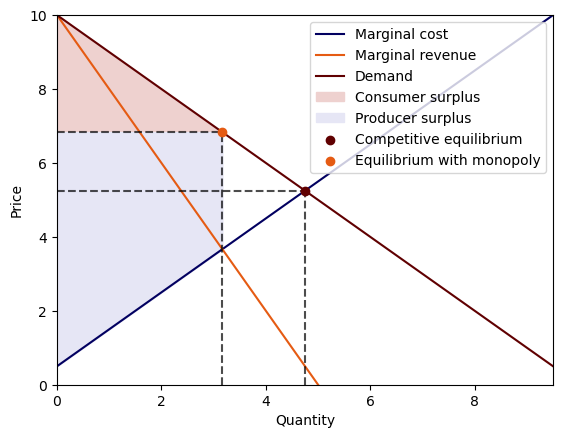
44.7.5. A monopolist#
Let’s consider a monopolist supplier.
We have included a method in our ProductionEconomy class to compute an equilibrium price and allocation when the supplier is a monopolist.
Since the supplier now has the price-setting power
we first compute the optimal quantity that solves the monopolist’s profit maximization problem.
Then we back out an equilibrium price from the consumer’s inverse demand curve.
Next, we use a graph for the single good case to illustrate the difference between a competitive equilibrium and an equilibrium with a monopolist supplier.
Recall that in a competitive equilibrium, a price-taking supplier equates marginal revenue \(p\) to marginal cost \(h + Hq\).
This yields a competitive producer’s inverse supply curve.
A monopolist’s marginal revenue is not constant but instead is a non-trivial function of the quantity it sets.
The monopolist’s marginal revenue is
which the monopolist equates to its marginal cost.
The plot indicates that the monopolist sets output lower than the competitive equilibrium quantity.
In a single good case, this equilibrium is associated with a higher price of the good.
class Monopoly(ProductionEconomy):

    def __init__(self,
                 Π,
                 b,
                 h,
                 J,
                 μ):
        """
        Inherit all properties and methods from class ProductionEconomy
        """
        super().__init__(Π, b, h, J, μ)


    def equilibrium_with_monopoly(self):
        """
        Compute the equilibrium price and allocation when there is a monopolist supplier
        """
        Π, b, h, μ, J = self.Π, self.b, self.h, self.μ, self.J
        H = .5 * (J + J.T)

        # allocation
        q = inv(μ * H + 2 * Π.T @ Π) @ (Π.T @ b - μ * h)

        # price
        p = 1 / μ * (Π.T @ b - Π.T @ Π @ q)

        if any(Π @ q - b >= 0):
            raise Exception('invalid result: set bliss points further away')

        return q, p
Define a function that plots the demand, marginal cost and marginal revenue curves with surpluses and equilibrium labelled.
44.7.5.1. A multiple good example#
Let’s compare competitive equilibrium and monopoly outcomes in a multiple goods economy.
Π = np.array([[1, 0],
              [0, 1.2]])

b = np.array([10, 10])

h = np.array([0.5, 0.5])

J = np.array([[1, 0.5],
              [0.5, 1]])
μ = 1

M = Monopoly(Π, b, h, J, μ)
c, p = M.competitive_equilibrium()
q, pm = M.equilibrium_with_monopoly()

print('Competitive equilibrium price:', p)
print('Competitive equilibrium allocation:', c)

print('Equilibrium with monopolist supplier price:', pm)
print('Equilibrium with monopolist supplier allocation:', q)
Competitive equilibrium price: [6.23542117 6.32397408]
Competitive equilibrium allocation: [3.76457883 3.94168467]
Equilibrium with monopolist supplier price: [7.26865672 8.23880597]
Equilibrium with monopolist supplier allocation: [2.73134328 2.6119403 ]
44.7.5.2. A single-good example#
Π = np.array([[1]])  # the matrix now is a singleton
b = np.array([10])
h = np.array([0.5])
J = np.array([[1]])
μ = 1

M = Monopoly(Π, b, h, J, μ)
c, p = M.competitive_equilibrium()
q, pm = M.equilibrium_with_monopoly()

print('Competitive equilibrium price:', p.item())
print('Competitive equilibrium allocation:', c.item())

print('Equilibrium with monopolist supplier price:', pm.item())
print('Equilibrium with monopolist supplier allocation:', q.item())

# plot
plot_monopoly(M)
Competitive equilibrium price: 5.25
Competitive equilibrium allocation: 4.75
Equilibrium with monopolist supplier price: 6.833333333333334
Equilibrium with monopolist supplier allocation: 3.1666666666666665
44.8. Multi-good welfare maximization problem#
Our welfare maximization problem – also sometimes called a social planning problem – is to choose \(c\) to maximize
minus the area under the inverse supply curve, namely,
So the welfare criterion is
In this formulation, \(\mu\) is a parameter that describes how the planner weighs interests of outside suppliers and our representative consumer.
The first-order condition with respect to \(c\) is
which implies (44.10).
Thus, as for the single-good case, with multiple goods a competitive equilibrium quantity vector solves a planning problem.
(This is another version of the first welfare theorem.)
We can deduce a competitive equilibrium price vector from either
the inverse demand curve, or
the inverse supply curve